Monday, June 19, 2017

June 20 is World Refugee Day


#WithRefugees Maps for World Refugee Day

According to the United Nations, every minute 20 people leave everything behind to escape war, persecution, and terror.  Nearly 66 million people were forcibly displaced from their homes last year as refugees. 

A refugee is someone who fled his or her home country to escape a natural or man-made disaster, and June 20 is commemorated as “World Refugee Day” by the United Nations.

“Every year on June 20th, we commemorate the strength, courage, and perseverance of millions of refugees.  This year, World Refugee Day also marks a key moment for the public to show support for families forced to flee.”  People can sign the #WithRefugees petition to express solidarity.

The Ball State University Libraries GIS Research and Map Collection (GRMC) provides access to the latest cartographic resources depicting a number of current events and social topics that may be used for research and learning.  Maps and atlases provide visual representations of global issues like refugees.  The GRMC collects the latest cartographic resources in the news and provides digital access to these cartographic visual aids for students and others writing research papers or researching social topics.

Business Insider published “mesmerizing maps” (above click to enlarge) created by Earth TimeLapse that show where refugees are leaving and arriving.  The data for the maps was provided by the United Nations High Commissioner for Refugees.  Each red dot represents 17 refugees arriving in a country, while yellow dots identify the home countries refugees are leaving.  The maps highlight the war-torn areas of the world from 2000 with the flow of refugees from Afghanistan, Congo, and Sudan to 2015 and the height of the Syrian crisis.

The New York Times regularly publishes maps covering current events.  A satellite map of Syria in 2012 (above) with the lights of major cities is compared to the same area in 2014 where many cities have been destroyed from the civil war.  The Times also created maps showing the European countries accepting refugees and a map of the United States showing where Syrian refugees were located from 2012 to 2015.

Some of the maps offer editorial views of the refugee crisis.  Forbes published a map identifying majority-Muslim countries with business ties to Trump businesses alongside majority-Muslim countries affected by the Trump “travel ban.”

The GRMC scours news sites to provide research assistance and access to the latest cartographic resources.  For more information about using maps as visual aids in research and creative writing, please contact the GRMC at 765-285-1097.


Civil Rights Maps in the News


Today in History:  Civil Rights on the Map

On June 19, 1964, the Civil Rights Act was approved by the Senate by a vote of 73-27, following a long filibuster by Senators Russell of Georgia and Byrd of West Virginia.  The bill passed in the House of Representatives and was signed into law by President Johnson on July 2, 1964.

The map above (click to enlarge) identifies the votes in the House of Representatives—green denotes a vote in favor of the Civil Rights Act, and red identifies the nay votes.  This map was published in the atlas Mapping America’s Past by Henry Holt available from Ball State University Libraries GIS Research and Map Collection (GRMC).  A description of the vote from the atlas details a little-known amendment added to the bill by the opposition:

Howard W. Smith, a Virginia Democrat, led the opposition.  When it became evident that the bill would pass, he slyly proposed an amendment that, in addition to barring discrimination in employment on account of race or religious beliefs, would also prohibit it on account of gender.  Smith hoped that the amendment, which threatened to transform almost every workplace in the nation, would cause moderate and conservative Republicans to vote against the entire bill.  As the bill’s managers scrambled to squash the Smith amendment, a bipartisan group of women representatives declared their support for what they called ‘this little crumb of equality.’  The bill’s supporters, after hastily rethinking the political consequences of opposing women’s rights, meekly endorsed the amendment.

To Smith’s chagrin, the Civil Rights bill—including his women’s rights plank—passed by a vote of 290 to 138….152 Democrats voted for the bill, only a handful of them from the South.  But almost as many Republicans (138) supported the bill….The bill also received strong bipartisan support in the Senate, which for the first time ever terminated a filibuster on civil rights legislation.

Both Republicans and Democrats from Indiana voted in unanimous support for the bill, as did representatives from Illinois, Maine, Vermont, Rhode Island, Pennsylvania, Minnesota, Kansas, Idaho, Colorado, New Mexico, Alaska, Hawaii, Utah, Oregon, and Washington.

With the passage of Civil Rights legislation, the publication of the famous “Green Books” ended.  The Negro Travelers’ Green Book was published by Victor Green beginning in 1936 and ending in 1964 with the passage of the Civil Rights Act.  These guide books listed restaurants, hotels, and other services that were available for Blacks when traveling across the country during the era of Jim Crow laws.

The New York Public Library has a collection of the books available from their Digital Collections.  And the University of South Carolina has an interactive online map based on the establishments listed in the 1956 book.  The GRMC used this edition of the book to create a map marking the locations of the cities in Indiana that had at least one restaurant, hotel, or other business listed in the Green Book, a little known part of American history.  (Photographs from the Libraries’ Digital Media Repository were included on the map).

The map is available in digital format from the Ball State University Libraries’ Cardinal Scholar and the GRMC teacher resources files under “Indiana history maps for displays.”  A Missouri version of the map is also available for download, and a map about the civil rights movement in Indiana is also included. 

Maps and atlases from the GRMC circulate for two weeks or longer.  Large-format plotter printing of maps and other resources is also available to members of the BSU community.

For more information, please contact the GRMC at 765-285-1097.

ESRI Story Map Celebrates the Architecture of Frank Lloyd Wright


Celebrating Classic American Architecture with Maps

June 8 marked the 150th anniversary of the birth of acclaimed architect Frank Lloyd Wright.  The National Trust for Historic Preservation is honoring Wright’s designs with a commemorative ESRI Story Map.

The Story Map was created using the popular ESRI GIS software.  The map allows users to explore buildings designed by Frank Lloyd Wright.  The buildings are categorized by date—1910 and before, 1911 to 1942, after 1945, and buildings that are lost or never built (which included a doghouse). 

Users can click on the locations on the map to see a description of the buildings, which includes Samara House in West Lafayette, Indiana (above).  Wright built the home between 1954 and 1956.  Wright noticed samara plants on a site visit and included the winged, chevron shape of the fruit into the design of the house.  The home is listed on the U.S. National Register of Historic Places and the National Historic Landmarks in Indiana.

Users can also tour the Pope-Leighey House in Alexandria, Virginia.  The home was built in 1939 and is operated by the National Trust for Historic Preservation.  This home includes the unique, simple designs made popular by Wright including clerestory windows for unobstructed views, built-in shelves, and cantilevered roof.

The Ball State University Libraries GIS Research and Map Collection (GRMC) on the second floor of Bracken Library provides access to the latest GIS software from ESRI and assistance from the GIS Specialist.  Computers throughout Bracken Library and the Architecture Library also offer access to GIS software.


For more information, please contact the GRMC at 765-285-1097.

Friday, June 16, 2017

Maps of Salem, Massachusetts Available from Ball State University Libraries


Maps in the News: Historic Salem, Massachusetts

The Ball State University Libraries GIS Research and Map Collection (GRMC) houses over 140,000 maps, atlases, and other cartographic resources on the second floor of Bracken Library.  The collection includes historic and modern maps of places around the world and may be used for research and learning.

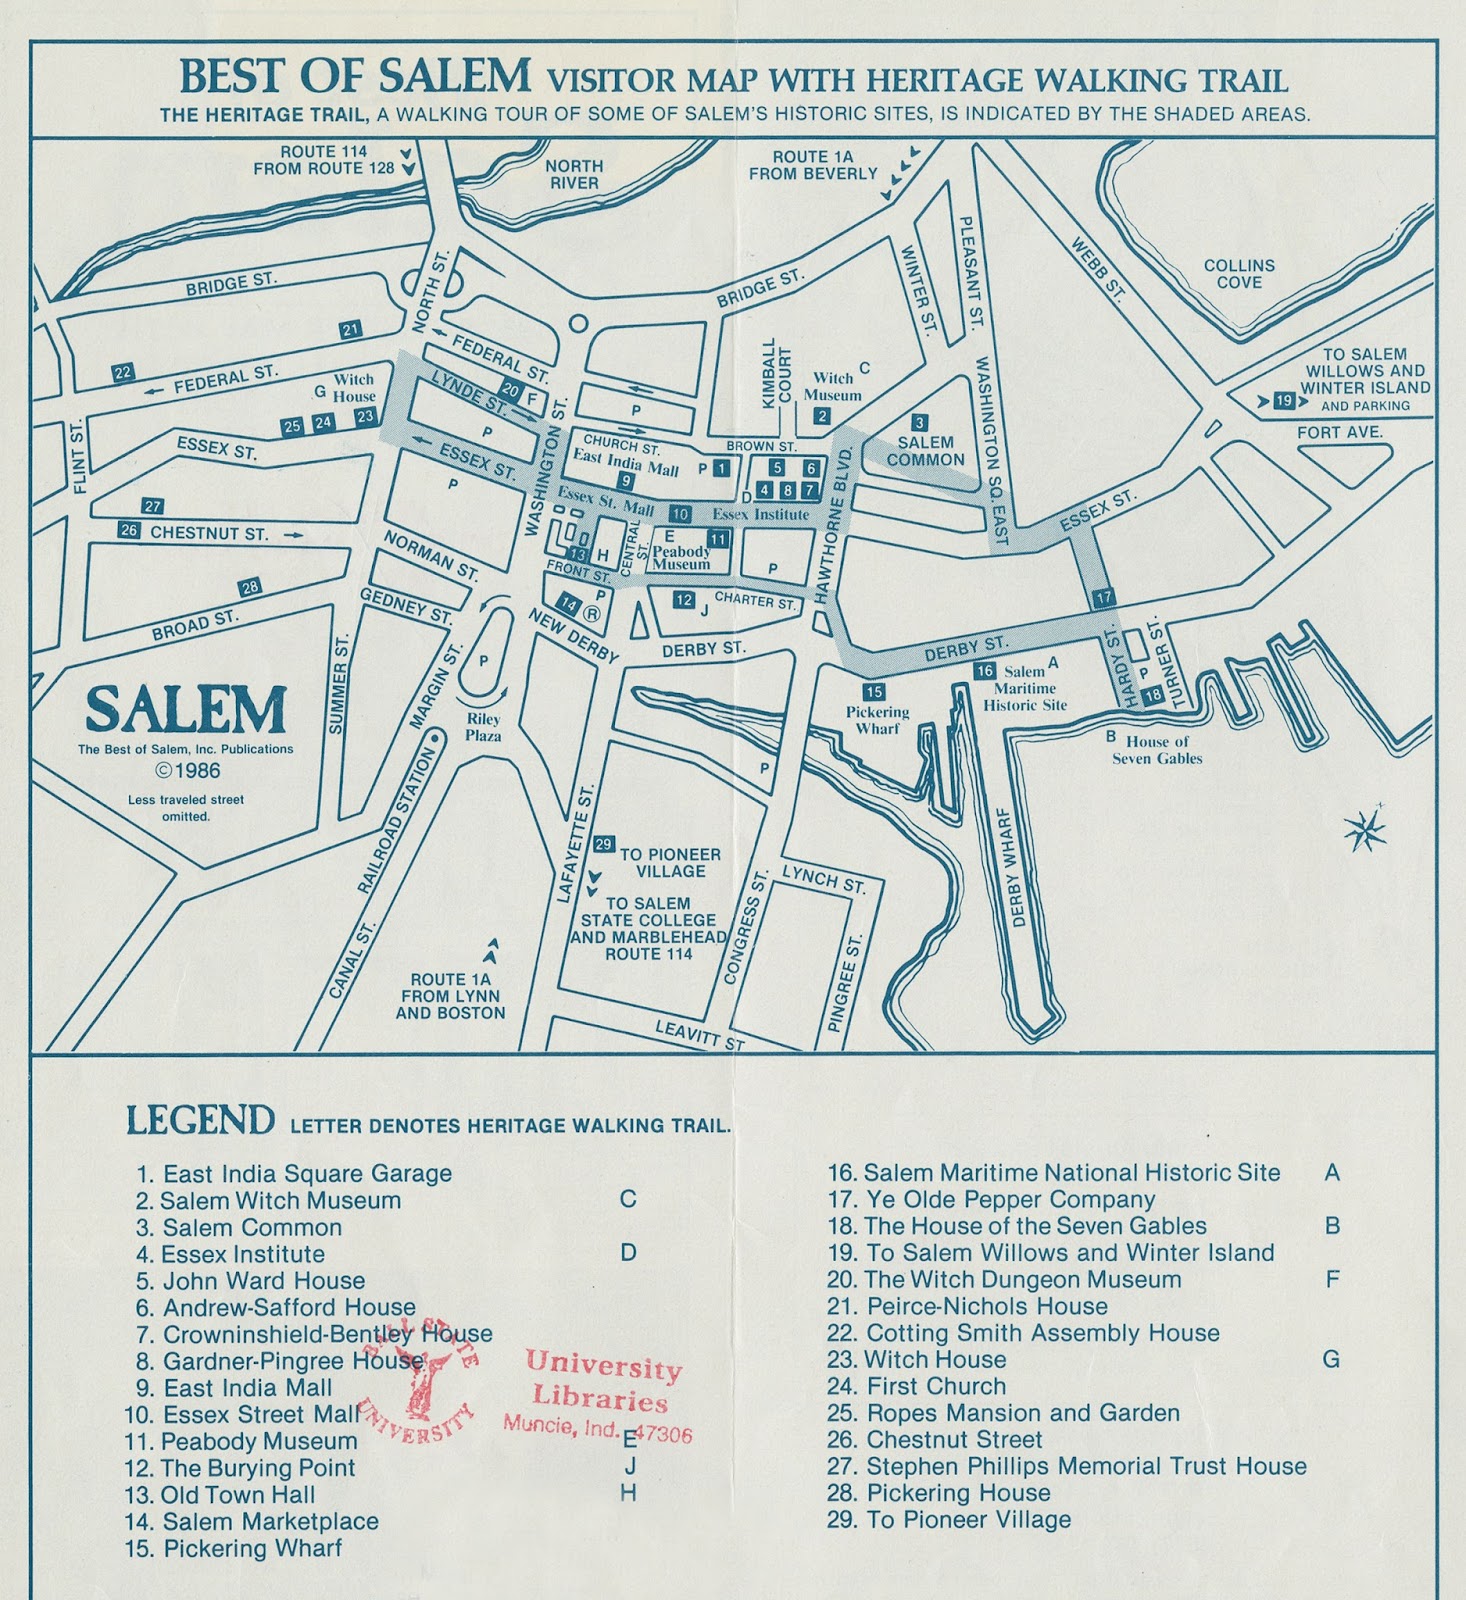
The GRMC includes a variety of maps depicting the historic town of Salem, Massachusetts.  Best of Salem, Massachusetts map (top, click to enlarge) includes a visitor map with the Heritage Walking Trail depicted in shading.  The verso includes an inset map of the general area near Salem and a business directory.

Historic Salem Massachusetts was published by the Salem Chamber of Commerce. The map identifies points of interest and information about the Salem Witch Museum.  The verso of the map includes photographs of the important places during the Salem witch trials like The Burying Point, the home of Judge Jonathan Corwin, and the Salem Witch Museum.

Maps from the GRMC may be borrowed for two weeks or longer.  For more information, please contact the GRMC at 765-285-1097.

Wednesday, June 07, 2017

London Maps Available from Ball State University Libraries


Maps in the News: London

The Ball State University Libraries GIS Research and Map Collection (GRMC) includes a large collection of maps and other cartographic resources of London, England.  The collection features original historic maps published by the Ordnance Survey (Britain’s mapping agency) and the U.S. Army Map Service as well as modern maps and travel guides.

The GRMC also has reproductions of historic maps of London.  London in the Time of King Henry V, 1413-1422 (above, click to enlarge) includes the principal streets and buildings in the city with the major streets, bridges, and buildings of today shown with shading.

Londinvm Redivivvm: Presented by Me to His Majesty, a Week After the Conflagration is a reproduction of a set of maps created by Sir Christopher Wren and John Evelyn after the 1666 fire in London.  The map was presented as a plan to rebuild the city for King Charles II upon his return to the throne in 1661.

A Prospect of London from the West was published in 1989 by Jamshid Kooros.  The map was created in the style of the maps of Christopher Wren.     

Maps from the GRMC may be circulated for two weeks or longer, and use for classroom exhibits may be accommodated.  For more information, please contact the GRMC at 765-285-1097.

Tuesday, June 06, 2017

D-Day Maps Available from Ball State University Libraries


Mapping History:  The Cartography of D-Day

Allied Forces invaded the beaches of Normandy, France, on June 6, 1944.  The Ball State University Libraries GIS Research and Map Collection (GRMC) includes several original maps and historical reproductions that depict the D-Day invasion.

The top map is an inset map from a Michelin map published in 1947 available from the GRMC that details the military actions of that day.  The map is printed in English and French. 

The GRMC also includes several maps produced by the Office of Strategic Services (intelligence agency) and the Army Map Service in preparation for the invasion.  This set of maps shows the locations of roads, railroads, ports, and other important sites.  The map of Northwest Normandy (above, click to enlarge) identifies the roads in the area of the invasion.  Even the creation of these maps was top secret as to not give the enemy any clues to where the invasion by Allied Forces of mainland Europe would occur.

The Army Information Branch in New York also published newspaper-type maps during World War II, and the GRMC includes several of these “Newsmaps.”  The photographs above from these maps show American and Canadian troops landing on the beaches of Normandy—Canadians with bicycles.  These photographs were included in the “Newsmap” published for the week of June 8, 1944.

The GRMC also includes a reproduction map of a reconnaissance aerial photograph of troops landing on Omaha Beach on D-Day.  Landing craft can be seen along the beach, and reinforced German lines are shown at the top of the map.

The D-Day Atlas: Anatomy of the Normandy Campaign is also available from the Atlas Collection on the second floor of Bracken Library.  The atlas was written by Charles Messenger in 2004 and includes maps and images from the D-Day invasion.  The Atlas Collection also includes Atlas of Special Operations of World War II, Military Atlas of World War II, U.S. Army Atlas of the European Theater in World War II, and Penguin Historical Atlas of the Third Reich.

The bottom image is a map featured in The Good Fight: How World War II Was Won by Stephen Ambrose.  This book is available from Educational Technology and Resources in the lower level of Bracken Library.

These historical maps and resources may be borrowed for classroom research or exhibits.  All maps from the GRMC circulate for two weeks or longer.  For more information, please visit or contact the GRMC at 765-285-1097 from 7:30 to 4:30 pm on the second floor of Bracken Library.

Wednesday, May 31, 2017

Spelling Skills on the Map


Spelling Makes the Map

The Scripps National Spelling Bee begins tonight in Washington, D.C.  The top 291 spellers advance to these finals out of the 11 million students who participated in local spelling bees.  But not all Americans count spelling as a strong suit.

Google Trends posted this map (above, click to enlarge) of the most misspelled words in each state.  Google created the map based on the most popular word followed “how to spell” in a search. 

The map is broken down by the length of the words.  So Georgia, Idaho, Mississippi, North Carolina, Oregon, Rhode Island, and Tennessee share the lowly distinction of searching for the smallest words.  Rhode Island’s most popular word is “liar,” and the hard-to-spell state of Mississippi searched for “nanny.”

Most of the United States searches for words that are from six to 10 letters long.  Some of these words are tricky, like “sauerkraut” in Pennsylvania and “Chihuahua” for Arkansas.  But New Jersey searched for “twelve;” South Dakota searched “college;” and Wisconsin actually searched the name of their state the most.

Texas and Missouri searched for a longer word—“maintenance.”  And West Virginia and Connecticut searched for a phrase from the musical “Mary Poppins,” which is “supercalifragilisticexpialidocious.”  (And Microsoft Spell Check acknowledges that word).


For more information about using maps to study culture and current events, please contact the Ball State University Libraries GIS Research and Map Collection.

Thursday, May 25, 2017

Map of the Life of President John F. Kennedy


JFK’s USA:  Map Exhibit Celebrating the 100th Birthday of President Kennedy


The Ball State University Libraries GIS Research and Map Collection (GRMC) is commemorating what would have been the 100th birthday of President John F. Kennedy with a special map exhibit.  The map identifies some of the important places around the United States in Kennedy’s life.  The map will be featured in the front windows of the GRMC on the second floor of Bracken Library.  It may be borrowed from the GRMC for educational research or classroom exhibits.

Wednesday, May 24, 2017

GRMC Closed for Holiday


The GIS Research and Map Collection (GRMC) will be closed on Monday, May 29 for Memorial Day. The GRMC will reopen on Tuesday, May 30 at 7:30 am. 

Friday, May 19, 2017

Environmental Maps Available from Ball State University Libraries

National Geographic "Africa Threatened"

National Geographic 2011


National Geographic poaching series

National Geographic poaching series

National Geographic poaching series


 World Wildlife Fund

University of Vermont Disappearing Bees

Vox Great Barrier Reef

World Atlas of Great Apes and Their Conservation
Ball State University Libraries Atlas Collection


Endangered Species Day on the Map

Today is recognized as “Endangered Species Day.”  The U.S. Fish and Wildlife Service marks this day to recognize the national conservation efforts to protect our nation’s endangered species and their habitats. 

According to Time magazine, conservation efforts became popular in the 1970’s.  The U.S. Endangered Species Act was passed in 1972, and many species have been saved from extinction—including the bald eagle.  But as scientists document more plants and animals, the list of endangered species grows, doubling in the past two decades.

The risk facing some of the “most recognizable animals is growing in urgency.”  Poaching continues to be a problem in Africa with thousands of elephants and white rhinoceros killed every year.  According to National Geographic, in 2011 poaching hit the highest level in a decade, with the greatest impact in the central Africa region.  The illegal trade in ivory and the horns of the rhinoceros is a major threat.  (Click maps above to enlarge).

The World Wildlife Fund created a “Wildlife Crime Scorecard” that grades countries’ commitments to fighting illegal trade of rhino horn, ivory, and tiger parts.  India and Nepal have made “some progress in key aspects of compliance and enforcement.”  The Central African Republic and the Democratic Republic of the Congo received failing scores in “key aspects of compliance and enforcement” as countries of origin in the trade of ivory.  Myanmar and Thailand received failing scores as destination markets in the illegal trade.

The World Wildlife Fund and other conservation efforts have been successful in the protection and management of the southern white rhinoceros.  They are classified as “near threatened,” and over 20,000 exist throughout four countries in Africa.  However, the northern white rhinoceros had about 2,000 existing in 1960.  But due to widespread poaching, there are only three northern white rhinos left on earth.  All three live in captivity, and reproduction efforts have been unsuccessful.

According to the Time article, other smaller species are also threatened.  The rusty patched bumblebee was officially listed as an endangered species in March of this year.  The species has faced an 87% decline since the 1990’s.  Other honeybees are also threatened due mostly to loss of habitat and available pollination sources.

Coral reef in oceans around the world are also facing endangerment due to pollution and the warming of ocean waters.  These reefs are critical to the biodiversity of the oceans and play a key role in maintaining fisheries.

The Ball State University Libraries GIS Research and Map Collection (GRMC) provides access to dozens of maps and other cartographic resources for projects related to endangered species and the environment.  The Atlas Collection on the second floor of Bracken Library includes several updated atlases about the environment that include unique maps, photographs, charts, and data for research and learning projects.

For more information, please contact the GRMC at 765-285-1097.
Tuesday, May 16, 2017

Instagram Map Exhibit at Ball State University Libraries


Hashtag Mapping, Hashtag Carte, Hashtag Mappe, Hashtag Cool Maps:  Instagram Map Exhibit in Bracken Library

As of April 2017, the popular photo-sharing application Instagram has a total of over 700 million registered users.  Colorful maps can be a fun and unique subject for sharing, so the GIS Research and Map Collection (GRMC) in Bracken Library has created a special exhibit dedicated to “Insta-worthy maps.”

The exhibit (above, click to enlarge) features 36 different cartographic images—all in the traditional square Instagram format.  Some of the maps are hand-drawn by Ball State University or Burris Elementary School students; some of the maps are from atlases or art books featuring maps; and some of the images feature objects made to look like maps or vice versa—like steak or bacon, a shark, the state of California as a cigarette, or a pile of laundry.


The exhibit will be featured in the front windows of the GRMC on the second floor of Bracken Library through the month of June.  Stop by to view these artistic maps or—better yet—visit the GRMC to snap some Instagram-worthy photos of some of the over 140,000 maps in the Collection.

Maps in the News: North Korea and the Ukraine


Maps in the News:  Where Is North Korea Anyway?

North Korea launched a ballistic missile on Sunday, and the nation has been a focus of foreign policy discussions.  The New York Times’ “The Upshot” published an experiment asking American adults to find North Korea on a map of Asia.  Then those same respondents were asked their opinions about military intervention in North Korea.

Of the 1,746 adults polled, only 36% were able to identify North Korea on the map (above, click to enlarge).  Some of the respondents even guessed that North Korea was located on a point in the ocean.  And of the respondents who could correctly identify North Korea, most tended to favor diplomatic or nonmilitary strategies of foreign policy.  Respondents who could not identify the correct location of North Korea favored direct military engagement, including sending ground troops.

A similar study was conducted in 2014 when Russia invaded Crimea in the Ukraine.  Americans were asked to find the Ukraine on a map of the world.  (On the map above, the guesses close to the location of the Ukraine are identified with redder dots).  And the researchers learned that the farther a respondent’s guess was from the Ukraine, the more likely that person would favor military intervention.

National Geographic sponsored a geography survey in 2006.  Nearly 90% of the respondents in that test could not locate Afghanistan on a map, 63% could not find Iraq on a map of the Middle East, and half could not find the state of New York on a map.

Even news media get geography wrong.  CNN used the map above in a story related to elections in the Ukraine.  But the location of the Ukraine is covered by the Ukrainian flag.  The map appears to be pointing to the region of Pakistan or Afghanistan.  For equal time:  Fox News identified the country of Iraq as Egypt, and MSNBC used a graphic of West Virginia for a story about Virginia elections.

The Ball State University Libraries GIS Research and Map Collection (GRMC) promotes geographic literacy and awareness by providing access to the latest cartographic resources for education and learning.  And the GRMC provides the latest maps of countries around the world for use in classroom lessons, exhibits, or other learning projects.  The GRMC even creates original geographic lessons, including one using some of the map “bloopers” shown.  And the GRMC provides custom instructional sessions, community presentations, and cartographic workshops to enhance geography skills.


For more information, please contact the GRMC at 765-285-1097.

Monday, May 15, 2017

Original Watercolor Maps Available from Ball State University Libraries


The Art of CARTography

The Ball State University Libraries’ Digital Media Repository (DMR) provides online access to a range of digitized primary source materials, including historic films and video, oral histories, diaries, photographs, cartographic resources, and artwork.  The GIS Research and Map Collection (GRMC) has provided access to hundreds of historic maps from its collection via this repository.  But the newest DMR collection from the GRMC is a set of hand-drawn maps created by students.

The name of the latest cartographic collection in the Digital Media Repository is “Home:  Artistic Watercolor Maps.”  The maps were painted by students in the fall semester 2016 watercolor class.  Hannah Barnes, Associate Professor in the Ball State University School of Art, created a project for her students:  After visiting the GRMC in Bracken Library and reviewing hundreds of maps, create an artistic map that represents the meaning of “home.”  (This is actually the second cartographic project and exhibit that Professor Barnes has coordinated with the GRMC).

Some of the students created maps representing more abstract meanings of “home,” while other students created more literal maps of their homes.  For example, Emily Dykstra created a map of her hometown neighborhood (above, click to enlarge) made to look like an ancient artistic manuscript style.  And Sean Chen created “Bridge” that included a view of Monument Circle in downtown Indianapolis overlain on a map of his homeland of China.  Finn Norris created a beautiful compass rose of Indiana cicadas on her map called “Unforgotten Memories.”

The original art was exhibited at the Muncie DWNTWN First Thursday Arts Walk in December of 2016 at the Twin Archer Brew Pub as part of the Indiana Bicentennial Celebration.  The artistic maps were included with maps created by students in Dr. Jorn Seemann’s geography class and Indiana history maps created by the GRMC.

For more information about creating cartographic art using the resources of the GRMC, please contact Melissa Gentry at 765-285-1097.


Tuesday, May 09, 2017

Teacher Resources from Ball State University Libraries


Teacher Resources from the Ball State University Libraries

Today is National Teachers Day, and as the school year ends, what better time than to plan new activities for next year?  The Ball State University Libraries’ GIS Research and Map Collection (GRMC) provides cartographic resources and lesson plans for use by K-12 teachers. 

The GRMC has created lesson plan guides that describe maps and lessons for teachers of social studies (including cultures and gender studies), science, art, English/literature, foreign language, and economics.  The lessons range in scope and including using topographic maps, understanding time zones, latitude and longitude, and using historic maps and online diaries to teach American history.

The GRMC has also created custom maps for use in classroom research projects or for bulletin board exhibits.  The GRMC published a collection of custom Indiana history maps in celebration of the state’s bicentennial in 2016.  And the GRMC creates custom map posters for the Ball State University International Center weekly culture exchange program that can be reused in the classroom or other exhibits.  Students in social studies methods classes at Ball State have also worked with the GRMC to create maps based on children’s books.

The GRMC has also created scores of classroom games, worksheets, cartographic tutorials, and other lesson plans for use by the K-12 teacher.  Some of the lessons are made to use with the historic collections in the Libraries’ Digital Media Repository.  These resources are all available for download for educational purposes, so teachers around the world with access to the Internet can use these cartographic resources.

For more information about using these classroom materials or to request a custom map for the classroom, please contact the GRMC at 765-285-1097.


Summer Hours in Map Collection


The Ball State University Libraries GIS Research and Map Collection will be open Monday through Friday from 7:30 am to 4:30 pm during the summer.

Mapping Flooding with GIS


Maps in the News:  Midwest Flooding

ESRI, the world’s leading producer of GIS software, and its ESRI Disaster Response Program provides software, data, imagery, project services, and technical support to organizations dealing with recent flooding in the Midwest.  Aerial photography from the National Oceanic and Atmospheric Administration (NOAA) of these affected sites is online.

Supporting organizations dealing with the flooding disaster can request assistance from ESRI.  Users can view continuously updated flooding information from the National Weather Service on the Public Information MapThe map details the levels of flooding from near flood stage to major flooding, and the site includes photographs and YouTube videos.  Users can type in a specific address to see the conditions on a map or via satellite imagery.

The Ball State University Libraries GIS Research and Map Collection (GRMC) on the second floor of Bracken Library provides access to the latest GIS software from ESRI and assistance from the GIS Specialist.  Computers throughout Bracken Library and the Architecture Library also offer access to GIS software.


For more information, please contact the GRMC at 765-285-1097.

Tuesday, May 02, 2017

Teachers Using Maps from Ball State University Libraries


Geography Students Learn about the Effects of Flooding Using Maps from Ball State University Libraries

Dr. David Call, Associate Professor in the Department of Geography at Ball State University, teaches a class called “Earth, Sea, and Sky: A Geographic View.”  In the class, students learn about selected aspects of the physical environment and their relationship to human occupancy of the earth.

Each year, the final project for the students in the class involves learning about the effects of flooding on various environments around the United States.  Dr. Call uses U.S. Geological Survey topographic maps from the Libraries’ GIS Research and Map Collection (GRMC) to show students how these environmental factors are depicted graphically on the maps.

Students use maps of New Orleans and Laplace, Louisiana, Chester, Illinois, and Natchez and Valley, Mississippi to study how the changing course of rivers affect state boundaries and land claims.  Students examine how New Orleans’ low elevation affects different parts of the city and how river deltas can be an excellent resource for fossil fuels.  Dr. Call also uses topographic maps from the GRMC for an assignment about cities in relation to rivers and mountains and the evolution of transportation.

The GRMC provides maps for professors, teachers, and students for presentations, classroom projects, and other learning activities.  Maps from the GRMC can be used for these special projects for the entire semester if necessary.  And maps from the GRMC can be provided in digital format for teachers and professors around the world. 

Please contact the GRMC at 765-285-1097 Monday through Friday to find out more about using maps in the classroom.